4 Critical Steps to Make Sense of Your Drip Campaign Data
Measuring the effectiveness of your automated email drip campaigns can be a little intimidating at first. As email distribution tools have evolved, there is now a plethora of metrics that you can use to evaluate drip campaigns. You have everything from unique open rates, click-through rates, and click-to-open rates to bounces, spam complaints, and landing page conversions. We’ve seen clients get lost in the data over and over again, resulting in no improvement in their campaigns over time. With a little planning, though, you can turn that around.
What Is an Email Drip Campaign?
 A “drip” campaign (also known as a nurturing campaign in the B2B world) involves setting up a series of email messages — sent at regularly timed intervals in response to a “trigger.” For example, if people sign up for your email newsletter, you could set up a calendar to send them an email every 2 weeks, or you could set up a more elaborate system to send specific emails to recipients who click through to specific newsletter promotions. Rather than sending each email separately, you can design an automated flow to contact different individuals at different times to help you effectively and efficiently bring prospects down the sales funnel.
Step 1: Set a Goal for Your Drip Campaign
The first step in making sense of your data is to be clear about the goal of your drip campaign. Typically, the goal of a drip campaign is to encourage your prospects to learn more about you and, ultimately, give you a call or perhaps purchase your product or service online. In this example, let’s assume that our goal is for the prospect to purchase a product online.
It’s important to realize that the purchase is the result of numerous events and decisions by the prospect. The extent that you can affect those events and decisions will determine how much you sell.
Step 2: Determine What Matters Most in Your Drip Campaign
The next step is to determine the events in your drip campaign that lead to a purchase. This may seem really straightforward to some of you, but stick with me. It gets even more exciting. In a drip campaign, the major factors include the following, which generally follow the typical sales funnel:
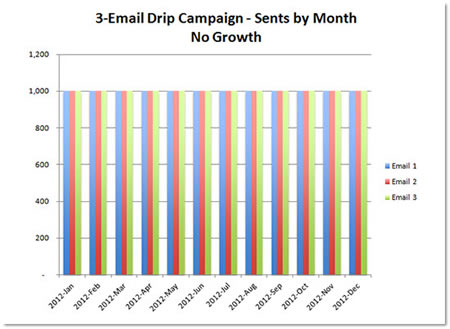
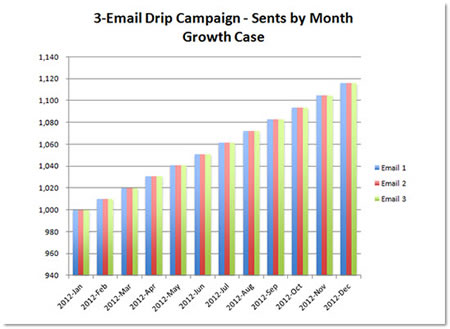
- Number of emails sent — This number is important because it’s a direct reflection on your lead-generation efforts. If you’re not seeing steady growth in these leads, you’ll most certainly have difficulty growing sales. Which situation below would you prefer for your campaign?
- Number of people who open the email — If a prospect doesn’t open your email, he or she is unlikely to see your message and make the desired purchase. It gets more complicated in a series of emails, as in a nurturing campaign, so understanding the level of engagement and your ability to impact that engagement throughout the campaign is critical to understand and to track.
- Number of people who click through to the landing page — These are the people who are really interested. The people who click are real prospects. They are now psychologically engaged to read the messaging on your landing page.
- Conversion — This is the ultimate event, when that prospect pulls out his or her credit card. But what is the conversion? It could be on your website. It could be a telephone call. Consider all of the ways that you consummate the deal and the metrics required to track all of them.


Step 3: Compile Your Email Metrics
Once you’ve determined the events that are most important to track, you must next compile the data so you can watch your trends. Sometimes, you may want to track these weekly, but if you don’t have a lot of data, monthly may be adequate. Create a process to pull your data into your reporting tool (e.g., MySQL, Excel). It’s best to automate this step when possible. If you’re using Lyris HQ or ExactTarget, you can leverage their API calls to extract much of this data automatically. Add a little formatting, some headings, and you have your dashboard.
Step 4: Optimize Your Drip Campaign with Valuable Email Metrics
Those are some of the basic metrics, but your work has just begun. What you need to do next is determine the metrics that are easily affected by some improvements. Then, you’ll want to track the necessary metrics to see how you’re doing. Here’s a great example.
Let’s say you want to figure out how to get more leads in at the top of the funnel. In the above example, you saw that we started out with 1,000 leads in the first month. As you grow over time, you’ll want to analyze where they’re coming from and how fast they’re growing from each of those sources. For example, imagine that you are getting your incoming leads from six different sources. Over time, each of those sources may be growing differently. Based upon what you learn by digging deeper, you can quickly discover where you have opportunity and where you have problems. You can see the trend lines that I’ve added. Some are clearly on the upswing, while others are going down.
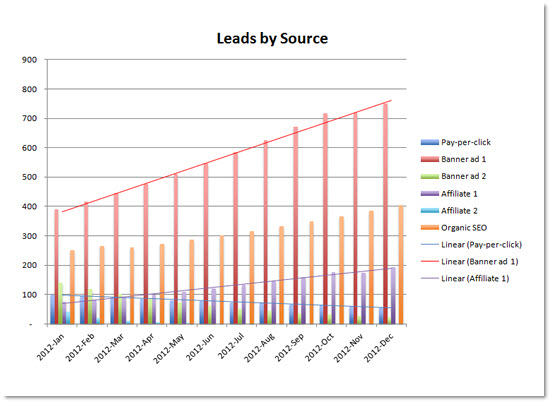
This dashboard is critical if you’re managing a number of affiliates and other sources. This will help you determine if incentives or other strategies are beginning to work as you watch your trends over time.
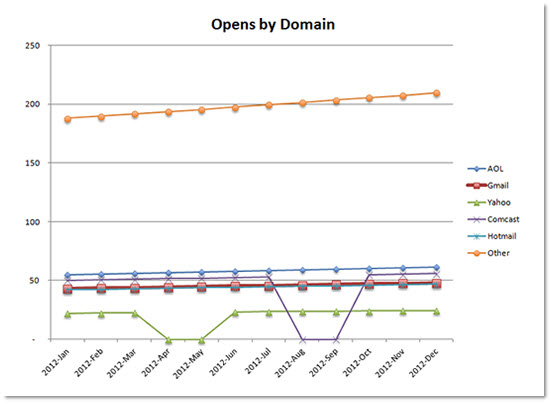
Perhaps your focus may then change to your open rates. There are many factors that affect open rates—subject lines, from name, preview pane, quality of your previous emails, and so on. If you’re trying to improve open rates, you can certainly try all kinds of testing, but you may quickly discover the importance of tracking your opens by domain. And, if you’ve ever had a deliverability problem, this is something you’ll also want to add to your dashboard. For example, suppose you have a lot of Yahoo email addresses. You should see at least some opening, but in the below trend graph, you’ll see that Yahoo has blocked you in April and May. So, opens by domain (as shown below) may be another important graphic to add to your dashboard.
As you can see, you can continue to peel back the onion to uncover the data that relates directly to each of your objectives. But your focus will likely change over time. So be sure to add and remove those metrics and trends that matter to you most at each point in time.
If you’re trying to get more out of your drip campaign and would like some help optimizing it, contact us or give us a call at 215-489-9336. We love this stuff!
- Email Drip Campaigns – Stay Top of Mind with These 5 Tips
- Move Prospects Down the Sales Funnel with Email
- Email-Marketing Optimization — 7 Steps to Effective A/B Split Testing
- Email Deliverability — What You Need to Know about Getting Your Emails to the Inbox
- How to Deal with Yahoo Email Delivery Issues